Climate Change
Reducing our impact on climate change
At G-Star, we recognize the critical role we play in mitigating climate change and the importance of reducing our carbon footprint. As a result, we focus our climate impact work on our supply chain and consumer engagement, while also taking steps in our own offices and stores.
Science Based Targets
In July 2019, G-Star RAW signed the UN Fashion Charter, pledging to meet emission reduction targets to align with the latest climate science – limiting global warming to below 2 degrees Celsius above pre-industrial levels. In November 2022, G-Star submitted its carbon reduction targets to the Science Based Targets initiative (SBTi), and the targets were validated in July 2023. Our partner, RESET Carbon Ltd. supported us throughout the process, creating an in-depth analysis of our carbon emissions, with 2021 set as our baseline year.
2021/22 Carbon Footprint Calculations:
Carbon accounting is broken down into three categories, defined by the Greenhouse Gas (GHG) Protocol standard: Scope 1, Scope 2, and Scope 3.
- Scope 1 includes GHG emissions directly emitted from G-Star owned and controlled operations (e.g., burning of fossil fuels when driving company cars, purchased electricity for stores)
- Scope 2 includes indirect GHG emissions from the generation of electricity, heat and steam purchased by G-Star
- Scope 3 includes indirect GHG emissions resulting from G-Star's activities that occur outside the company’s immediate control – (e.g., purchased goods and services, transport and distribution, business travel, employee commuting, use of sold products)
The guidelines for conducting this analysis were provided by international standards, along with accurate data and robust estimation methods. Furthermore, to ensure the validity of our results, the 2022 carbon inventory was verified by a 3rd party – Carbon Footprint Ltd.
Carbon Footprint Ltd. provided limited assurance for the 2022 carbon inventory, according to the ISO 14064-3:2019 Standard, meaning that G-Star's GHG emissions statement is:
- Materially correct, and is a fair representation of the GHG emissions data
- Prepared in accordance with the GHG Protocol
It is of Carbon Footprint Ltd.’s opinion that G-Star RAW has established appropriate systems for the collection, aggregation, and analysis of quantitative data for determination of GHG emissions for the 2022 period and boundaries.

Scope 1 & 2 Emissions:
Over 115 owned and operated G-Star locations were included in the 2022 reporting period. The table below has a breakdown of the locations, and countries.
| Country | Number of site(s) |
|---|---|
| Netherlands | 24 |
| France | 20 |
| Japan | 18 |
| Belgium | 13 |
| Germany | 13 |
| United_States | 11 |
| South_Africa | 4 |
| Canada | 3 |
| Austria | 2 |
| Switzerland | 2 |
| Spain | 1 |
| Bangladesh | 1 |
| China | 1 |
| Macau | 1 |
| Ireland | 1 |
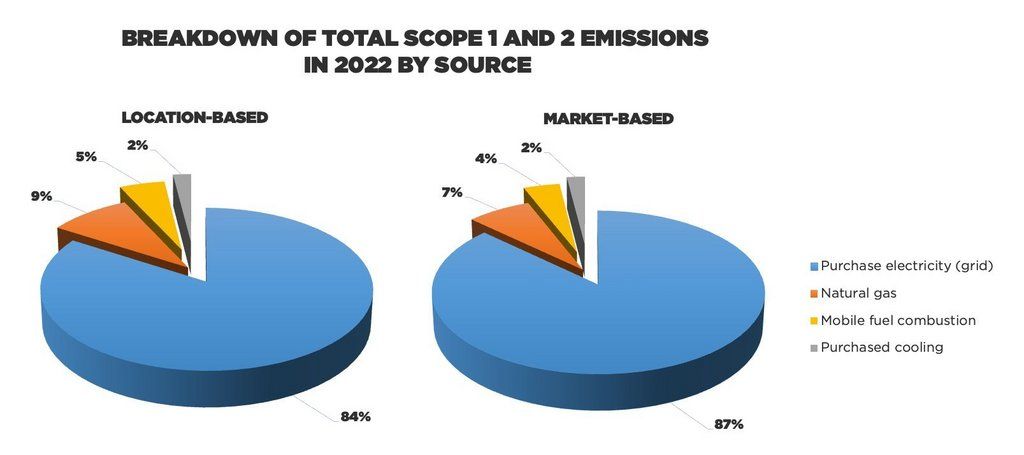
In 2022, Scope 1 and 2 totaled at 2.403 tCO2e location-based emissions, and 3.089 t C02e market-based emissions. Compared to emissions recorded in 2021, location-based emissions were reduced by 15%, and market-based emissions by 4%. In general, purchased electricity was a substantial portion of Scope 2 emissions – representing 97% of it (based on location-based calculation method). Scope 1 emissions can be attributed to natural gas combustion, making up 63%, and mobile fuel combustion contributing to the remaining 37%.
Scope 3 Emissions:
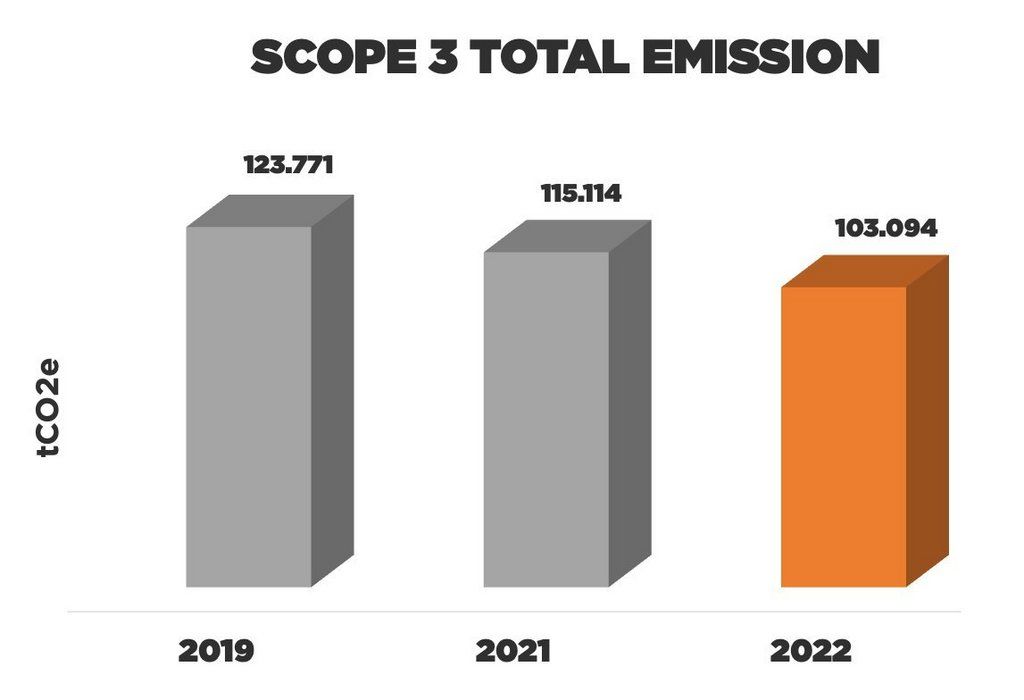
As expected, Scope 3 emissions accounted for almost 97% of the company’s total emissions, totaling around 103.094 tCO2e. Compared to 2021, this value was reduced by about 10%.
There are 15 categories included in Scope 3 GHG Protocol standard. However, not all are relevant to G-Star's business model (e.g., investments and processing of sold products). The categories deemed relevant to G-Star's business model can be seen below:
| Scope 3 Category | 2021 | 2022 | % change |
|---|---|---|---|
| Cat 1 - Purchased goods and services |
35.836 | 37.943 | 6% |
| Cat 1 - Purchased goods and services |
13.249 | 14.469 | 9% |
| Cat 1 - Purchased goods and services (Other) | 13.003 | 7.753 | -40% |
| Cat 3 - Fuel- and energy related | 626 | 703 | 12% |
| Cat 4 - Upstream transportation and distribution | 24.865 | 11.351 | -54% |
| Cat 5 - Waste generated in operations | 709 | 188 | -73% |
| Cat 6 - Business travel | 222 | 567 | 155% |
| Cat 7 - Employee commuting | 2.513 | 3.209 | 28% |
| Cat 11 - Use of sold products | 21.987 | 25.206 | 15% |
| Cat 12 - End-of-life treatment of sold products | 515 | 803 | 56% |
| Cat 13 - Downstream leased assets | 386 | 169 | -56% |
| Cat 14 - Franchises | 1.202 | 732 | -39% |
Among the Scope 3 categories, “Category 1, Purchased Goods and Services” had the highest contribution, making up 58% of the total. Category 1 emissions can be further broken down into sub-categories: Tier 1&2, which are the emissions of factories responsible for manufacturing the fabrics and finished goods purchased by G-Star, Tier 3&4, which are the emissions linked to materials used in G-Star products, and other, emissions related to all other purchased goods and services (e.g., trade marketing, security, insurance, office supplies). Following this, categories 11 and 4 “Use of Sold Products” and “Upstream Transportation” had a contribution of 24% and 11%, respectively.
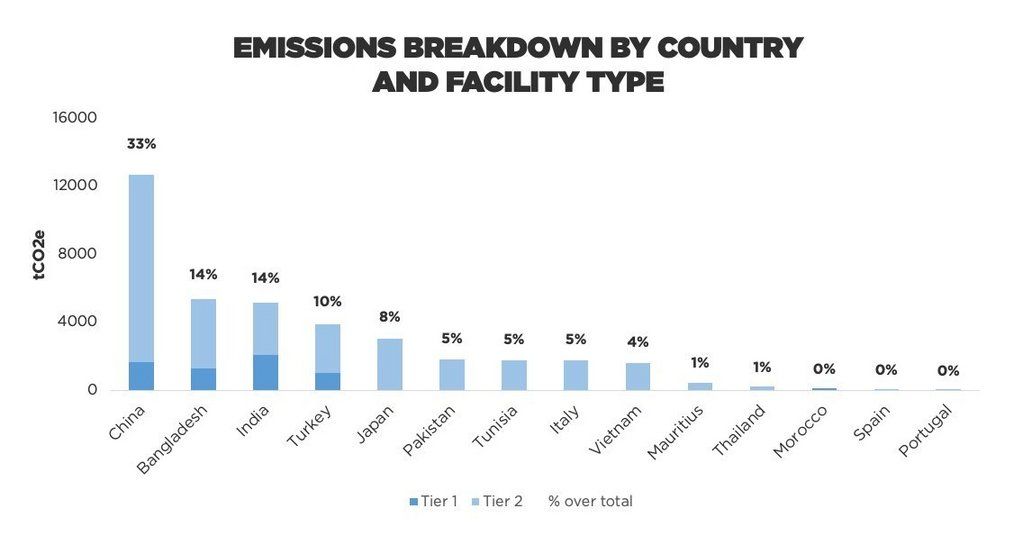
By segmenting the emissions, purchased electricity is the hotspot for all types of fuel and energy for Tier 1&2 suppliers. When analyzing per country, China emerged as the largest contributor with 33% of Tier 1&2 emissions, followed by Bangladesh, India, and Turkey.
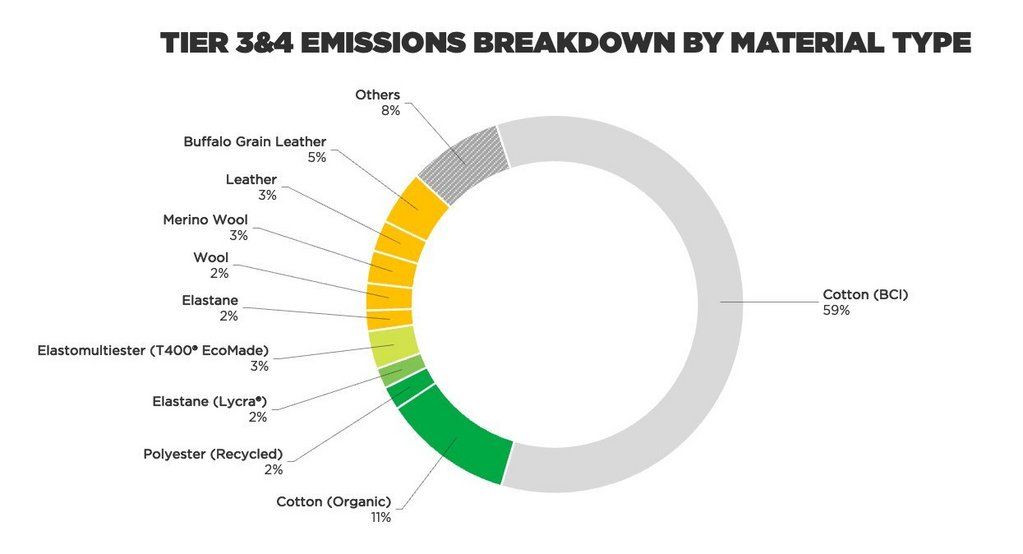
In terms of materials (Tier 3&4), cotton amounted to 72% of total material emissions, with BCI (Better Cotton Initiative) cotton at 59% of the total. This can be attributed to the large quantities that we source.
Taking a detailed look at some of our most meaningful categories, the overall performance of our Scope 3 emissions is twofold. In Category 1, an overall 9% increase was seen in 2022 compared to 2021, while also having a 20% increase in total production weight. In terms of Category 4, a significant reduction of 54% was achieved compared to 2021. This is due to the substantial decrease in inbound air shipment volume.
For further and detailed information regarding G-Star's carbon emissions, including data quality, calculation methodologies, and methodology updates, please refer to the G-Star RAW 2023 Sustainability Report.